Property Details page provides users with all key performance indicators regarding the property.
Intended Users
About
The Property Details Page is the most important page in Cribs. Everything in Cribs is centred around the Property Details page. It shows all the key performance indicators of the property and provides the overall profile of the property. The information is divided into 3 main parts – the summary of the property, the financials of the property, and the different components that allows users to analyse the property in detail.


Elements
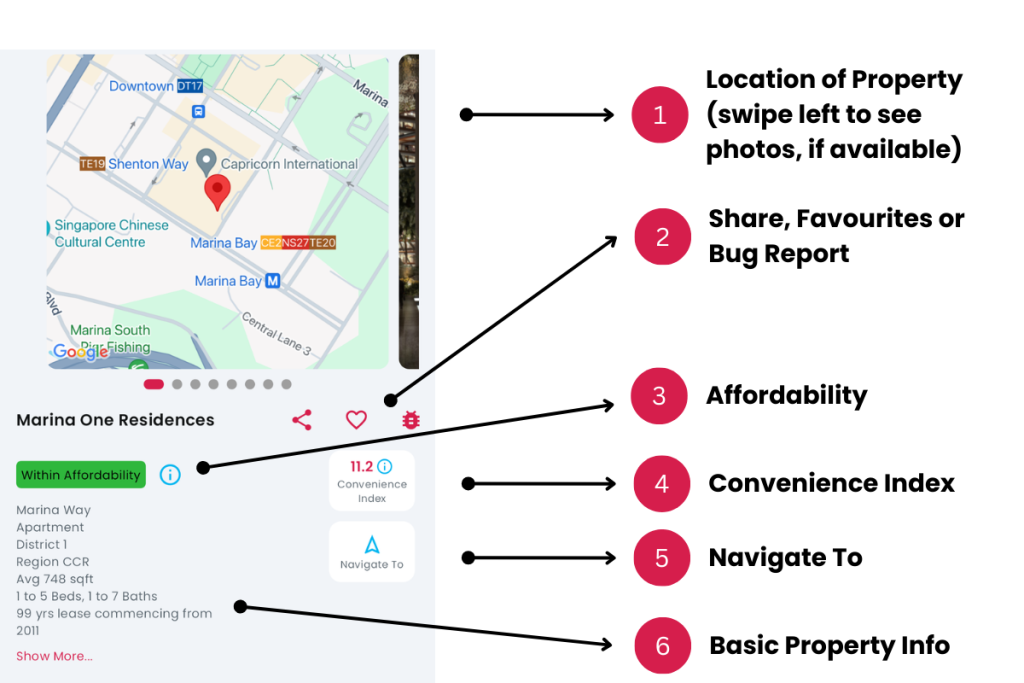
1. Location of Property
- Description: The geolocation of the property is displayed over Google Maps. The longitude and latitude coordinates are obtained from OneMap API.
- Tip: Photos of the property may be available and users can swipe left to reveal them.
2. Share, Favourite or Bug Report
- Description: Users can share the property via text, WhatsApp or any messenger that is supported by the device. Users can also tap on the Heart icon to save the property as a Favourite. In addition, users can report an error to Cribs by tapping the Bug icon and providing details.
- Tip: Tap on the Heart icon to save the property as a Favourite. You can view all your Favourites from the Home Page top right corner.
3. Affordability
- Description: If the user completes the Affordability Analysis during Registration or Revise My Analysis, each property viewed through the Property Details page will indicate if the user would be able to afford the property, based on the financial profile provided. Tags such as ‘Within Affordability’, ‘Barely Affordable’ and ‘Beyond Affordability’ will indicate if the property is within the financial means of the user. This information is private and confidential and is protected strictly under the guidelines of Cribs’ privacy policy. View the Buyer/Seller, Renter Affordability Analysis guide, or if you are an Agent, view the Agent Onboarding process.
- Tip: Complete your affordability analysis as it provides key information on your financial ability to own the property. Tap on the Information (i) icon to view your Affordability Assessment.
4. Convenience Index
- Description: Convenience Index is a scale of 1 to 100 on the convenience of the property across 5 major factors – Transportation, Amenities, Healthcare, Food and Education. Depending on the number of physical locations of these conveniences, a score will be given to each property. These scores are normalised across all Private Properties and HDB Flats across Singapore. Click on the Convenience Index to go Convenience Index Page for more details.
- Tip: The most convenient properties in Singapore are situated in HDB Towns or Downtown Singapore.
5. Navigate To
- Description: Navigate To launches Google Maps with the property as the destination in Longitude and Latitude. It provides users with a convenient way to use their devices to find the property and commute to it.
- Tip: You can use this function to estimate the commute times between your workplace and the property.
6. Basic Property Information
- Description: Displays basic information of the property in terms of the street, district or town (HDB), market segment or region, tenure of the property, the median size (in sqft), range of bedrooms, bathrooms and optionally, land size, developer, TOP date, etc where available.
- Tip: Leasehold and Freehold property information is found here.
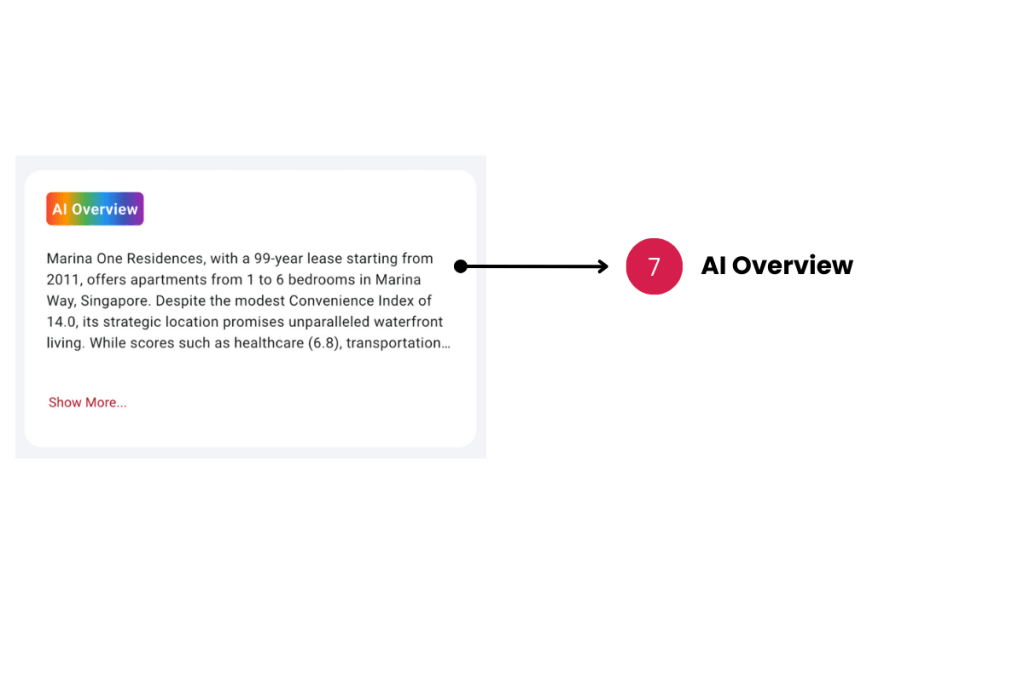
7. AI Overview (New, for Pro/Ultra users only)
- Description: An AI generated overview is a leap in capability over other Apps and summarises key information about the project. It is presented in a concise manner, based on the latest information about the project. The overview changes as new information is obtained about the project and provides high level recommendations for investors, buyers and renters. This feature is only available for Pro and Ultra users.
- Tip: Check the overview frequently for changes in the information.
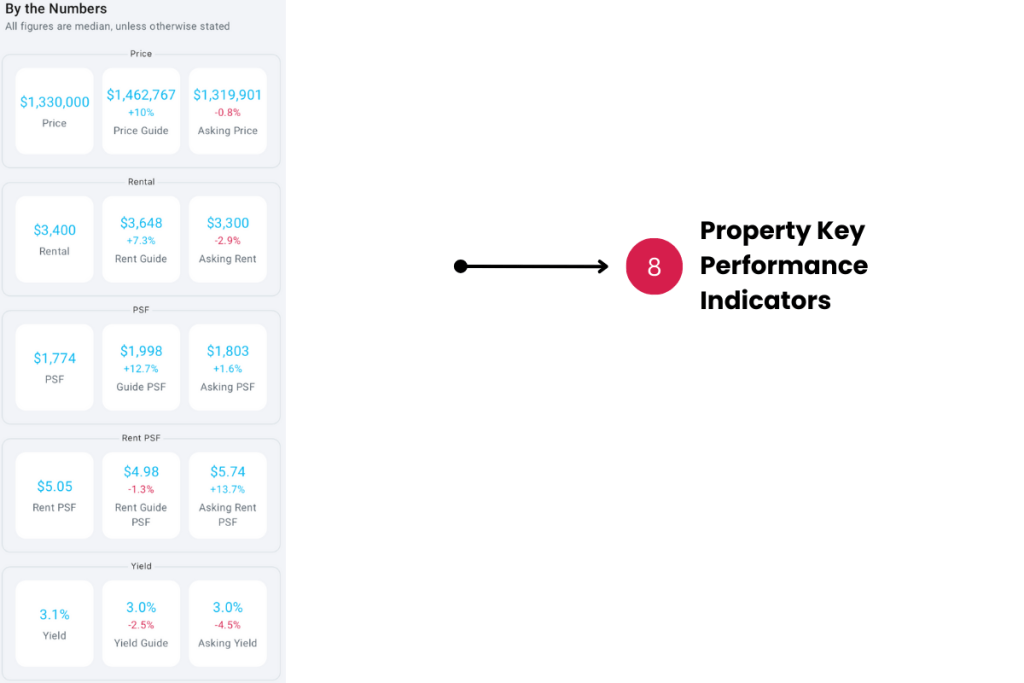
8. Property Key Performance Indicators
- Description: Displays the high level financial key performance indicators of the property.
- Tip: The comparisons in the Guide and Asking KPIs are based on the median KPIs of the property.
a) Price is the median price of the property based on the last 12 months transactions. More information about sales transactions are found on the Recent Sales page.
b) Rental is the median rental of the property based on the last 12 months of rental transactions. More information about rental transactions are found on the Recent Rentals page.
c) PSF is the price per square-feet of the property, calculated by the median price of the property, divided by the size of the property in square-feet. This is a key indicator of the value of the property. One of the key strengths of Cribs is PSF Analysis, found later in the Learn More functions that compares PSF across the property’s ecosystem. It indicates the financial health of the property, in comparison to the market.
d) Rent PSF is the rental per square-feet of the property, calculated by the median rent of the property (if available), divided by the size of the property in square-feet. This is also a key indicator of the value of the property. Another key strength of Cribs is Rent PSF Analysis, found later in the Learn More functions that compares Rent PSF across the property’s ecosystem. It indicates the ability of the property in the rental market.
e) Yield is calculated by the annual median rent, over the median price of the property. Simply put, from an investor’s perspective, for example, $1m was invested in the financial markets and obtained an interest return of 5% annually. This would be equivalent to investing in a property of $1m value, that is rented out for $4,166 per month, yielding 5%. This would assume no capital appreciation on the $1m invested.
f) Guide Price is the projected price of the property, based on past sale transactions. The value is calculated based on Machine Learning algorithms to predict the price movement of the property. There are many factors that are considered in this value and the breakdown is shown in the Price Guide of Learn More options. The comparison percentage is calculated to the median price of the property.
g) Rental Guide Price (not available for HDB) is the projected rental of the property, based on past rental transactions. The value is calculated based on Machine Learning algorithms to predict the rental movement of the property. There are many factors that are considered in this value and the breakdown is shown in the Rental Price Guide of Learn More options. The comparison percentage is calculated to the median rental of the property.
h) Guide PSF is the projected price per square-feet of the property, calculated by the projected price of the property, divided by the size of the property in square-feet.
i) Guide Rent PSF (where available) is the projected rental per square-feet of the property, calculated by the projected rent of the property (if available), divided by the size of the property in square-feet. This is not always available as there may not be any rental transactions for Cribs to make a prediction.
j) Guide Yield is calculated by the annual projected rent, over the projected price of the property.
k) Asking Price is the median asking price in the market, based on the sales listings from major property platforms. This value may not be available if there are no listings in the market for this property.
l) Asking Rent Price is the median rental asking price in the market, based on the rent listings from major property platforms. This value may not be available if there are no listings in the market for this property.
m) Asking PSF is the listings price per square-feet of the property, calculated by the listing median price of the property, divided by the size of the property in square-feet. Cribs takes into account the sales listings for the property across major property platforms. This value may not be available if there are no listings in the market for this property.
n) Asking Rent PSF is the listings rent per square-feet of the property, calculated by the listing median rental of the property, divided by the size of the property in square-feet. Cribs takes into account the rental listings for the property across major property platforms. This value may not be available if there are no listings in the market for this property.
o) Asking Yield is calculated by the annual asking rent, over the median asking price of the property.
9. Learn More Options
- Description: Learn More Options allows a user to deep-dive on a property and analyse the various KPIs of the property. This is the core strength of Cribs vs. other residential property or listings apps in Singapore, in terms of providing advanced analytics for every property in Singapore.
- Tip: PSF Analysis for Sales and Rent provides advanced analytics capabilities on a property’s PSF and allows the user to visualise each PSF data point in a combined chart, comparing past sales, listings and vicinity transactions, all within the past 12 months.

A) Properties Like This shows all properties in Singapore that are similar in financial KPIs in terms of median price, median rent, PSF and yield. This is a narrow match and will only display properties with similar attributes. Tap on this option button to view page. For more information, view the help page.
B) Recent Sales shows all past sales transactions for the property, extracted daily from URA. Cribs is functionally different from other platforms that provides past transaction information. The importance of transaction history is not only to show a record of sales accurately, but to use it as a data point for KPI calculation. Tap on this option to view page. For more information, view the help page.
C) Recent Rentals shows all past rentals for the property, extracted daily from URA. Cribs is functionally different from other platforms that provides past rental information. The importance of rental history is not only to show a record of rentals accurately, but to use it as a data point for KPI calculation, which is lacking from other platforms. Tap on this option to view page. For more information, view the help page.
D) Guide Prices breaks down predicted sale prices based on floor range, types of sizes of the property, property type and much more. Advanced Machine Learning algorithms are used to provide a predicted value. This should be used as a guide and not as key information in the decision to invest in this property. All investments come with risks and the responsibility to invest should be borne entirely by the investor. Tap on this button to view Guide Prices for this property. For more information, view the help page.
E) Rental Guide Prices breaks down predicted rental prices based on floor range, types of sizes of the property, property type and much more. Advanced Machine Learning algorithms are used to provide a predicted value. This should be used as a guide and not as key information in the decision to invest in this property. All investments come with risks and the responsibility to invest should be borne entirely by the investor. For more information, view the help page.
F) Conveniences shows the major conveniences around the property. It provides a Convenience Index that is a scale of 1 to 100 on the convenience of the property across 5 major factors – Transportation, Amenities, Healthcare, Food and Education. Depending on the number of physical locations of these conveniences, a score will be given to each property. These scores are normalised across all Private Properties and HDB Flats across Singapore. Click on the Convenience option to go to the Convenience Index Page for more details. For more information, view the help page.
G) More About This District/Town (HDB) shows more information about the property’s district or town (HDB). It has information such as Latest Sales and Rentals, Best Sellers, Latest Sales and Rental Listings, the Average Prices and Rents and Units Sold/Rented over the last 12 months. If it is a HDB Town, it also shows Upcoming Minimum Occupancy flats, Ethnic Groups, Dwelling Types and Mode of Transportation. For more information on District page, view the help page.
H) More About (CCR, OCR, RCR) shows more information about the property’s market segment, or region (available for private properties only). It has information such as Latest Sales and Rentals, Best Sellers, Latest Sales and Rental Listings, the Average Prices and Rents and Units Sold/Rented over the last 12 months in the market segment or region. For more information, view the help page.
I) Sales Around This Property shows the latest sales transactions, 500m around the property. This provides an indication of the different prices and PSF comparisons, with respect to the property. For more information, view the help page.
J) Rentals Around This Property shows the latest rental transactions, 500m around the property. This provides an indication of the different rental prices and Rent PSF comparisons, with respect to the property. For more information, view the help page.
K) AI Advisor is an AI enabled chat module that allows a user to ask about the property or anything that is relevant in terms of real estate in Singapore. The model has been trained specially for real estate or property enquiries in Singapore. This should be used as a guide and not as key information in the decision to invest in this property. All investments come with risks and the responsibility to invest should be borne entirely by the investor. Speak with a CEA Salesperson on real estate and property matters for accurate and up-to-date advice.For more information, view the help page.
L) Sales Listings shows the latest sales listings across major property platforms for the property. Users can get more information by tapping on each record to go to the external website. Users can also filter by platform type to view listings of the platform for the property. Sales Listings are updated daily and Asking KPIs are updated to reflect the financial KPI of the property. The number of listings is shown on the icon. Properties with zero (0) sales listings will not launch the sales listings page. For more information, view the help page.
M) Rental Listings shows the latest rental listings across major property platforms for the property. Users can get more information by tapping on each record to go to the external website. Users can also filter by platform type to view listings of the platform for the property. Rental Listings are updated daily and Asking KPIs are updated to reflect the financial KPI of the property. The number of listings is shown on the icon. Properties with zero (0) rental listings will not launch the rental listings page. For more information, view the help page.
N) PSF Analysis a powerful module that provides advanced analytics to combine 3 major elements of transactions – property sales transactions, sales listings and vicinity sales (sales around this property). The time horizon is 12 months and each group of PSF is mapped on a combined chart to show the relationship between the property’s PSF trends, vs. what is being asked in the market, vs. the surrounding properties. This is used to understand the relationship between the property and its ecosystem and would be useful in pricing a property for sale. For more information, view the help page.
O) Rent PSF Analysis is another powerful module that provides advanced analytics to combine 3 major elements of transactions – property rental transactions, rental listings and vicinity rents (rents around this property). The time horizon is 12 months and each group of PSF is mapped on a combined chart to show the relationship between the property’s PSF trends, vs. what is being asked in the market, vs. the surrounding properties. This is used to understand the relationship between the property and its ecosystem and would be useful in pricing a property for rent. For more information, view the help page.
P) Active Agents provides a snapshot of all agents that are currently actively marketing the property, based on sales or rental listings. Besides understanding the popularity of the property in terms of sales or rents, it is also useful to understand the competitive landscape of the property’s agents. For more information, view the help page.
10. Energy Guide
- Description: Energy Guide shows the typical estimate of energy usage based on the size of the property and the current Singapore Power’s electricity tariff on KWh.
- Tip: Household energy usage varies depending on usage.
11. Property Tax
- Description: Displays the estimated property tax calculation based on the property’s potential rental (and hence, annual value). For HDB flats, the annual value is provided by IRAS for 1-2 rooms, 3 room, 4 room, 5 room and executive flats, and property tax estimations are calculated. For more information, visit IRAS.
- Tip: Only Owner-occupied property tax computations are provided.
12. Home Loan
- Description: Displays the Home Loan estimation, based on the median price of the property and the financial profile of the user, provided by the user. Any parameters of the loan can be changed to analyse the impact to monthly repayments. Seek assistance from a financial consultant or institution regarding the accuracy of the figures and ability to finance the property. The Home Loan block will not appear if the user is a Renter.
- Tip: The interest rate is based on 3-Month SORA, provided by MAS.
Exceptions and Error Handling
Affordability tags are not shown
Description: If you don’t see any affordability tags such as ‘Within Affordability’, ‘Barely Affordable’ or ‘Beyond Affordability’, or you have not completed the Affordability Analysis.
Solution: Go to Home page, click on your User Profile where the message ‘Affordability Analysis not completed’ and complete your Affordability Analysis. View the Buyer/Seller, Renter Affordability Analysis guide for more information.
Rental information not available tag is shown
Description: If you see the tag ‘Rental Information is not shown’ and your user profile is ‘Renter’, this means that the property does not have any rental transactions yet, even if there may be Rent Listings. Cribs is unable to assess the property based on your Affordability Assessment as a Renter.
Solution: None, or speak to an Agent/CEA Salesperson on potentially renting any units in the development.
Contact and Support
Need further assistance? Contact our support team via the About section on our website or email support@cribs.com.sg
