Rent PSF Performance page provides users with comprehensive view of a property’s historical Rent PSF in relation to the district, and market segment Rent PSF.
Intended Users
About
Rent PSF Performance page is a new feature of Cribs and provides users with an advanced analysis of a property’s historical Rent PSF performance in relation to the District or Market Segment’s Rent PSF of the same property type. Pricing alone does not play a significant part in a property’s performance, since there could be various sizes, number of bedrooms, etc. PSF is consistently used as a measure of the strength of the property’s fundamentals. But also the underlying strength is the rentability of the property and the premium it commands. Having a higher Rent PSF ultimately leads to higher Yields. Cribs uses advanced analytics visualisation to present users with a combined view of a property’s Rent PSF in its ecosystem. This is a powerful feature of Cribs as it allows users to understand a property’s Rent PSF and if it is out-performing or under-performing the District or Market Segment. AI is used to understand the implications and comparisons between the property’s rent PSF, the district’s Rent PSF and the market segment’s PSF. This is one of the key decisions when investing in a property. Understanding its underlying performance is critical to long term results. This page is launched from the Property Details page, under Learn More options.

Elements
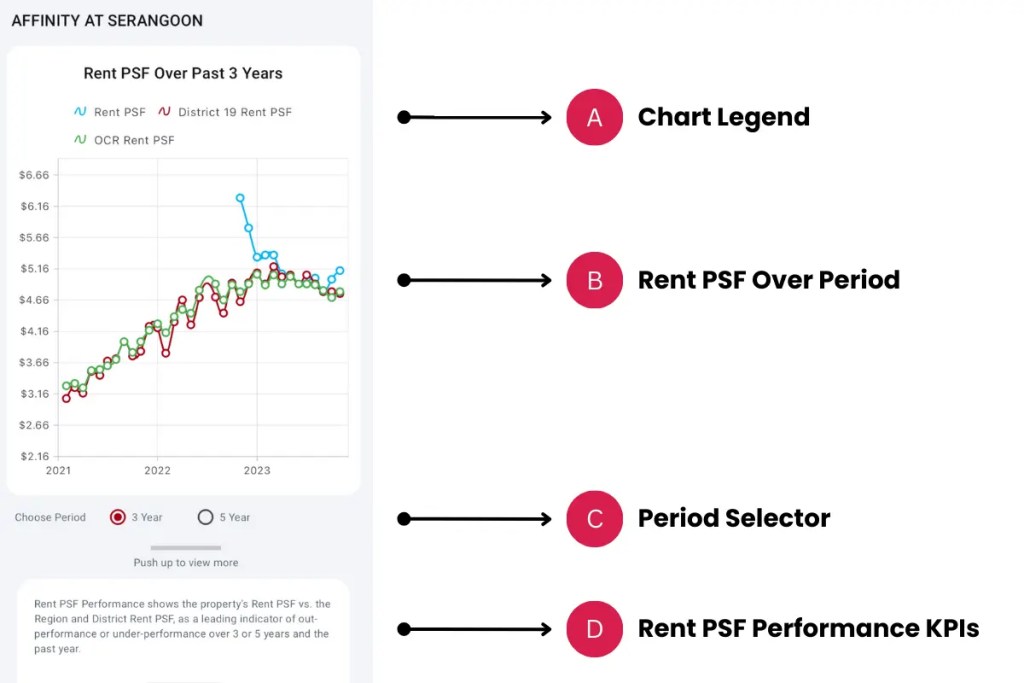
A. Chart Legend
- Description: The different types of data is visualised according to colour. Blue for current property, Red for District, and Green for Market Segment or Region.
- Tip: Understand the different trends through the colour codes.
B. Rent PSF Over Period
- Description: This chart shows the respective Rent PSFs over a given period. The current property’s trend is overlay with the District’s trend and the Market Segment’s trend.
- Tip: It is important to understand where the current property’s Rent PSF performance vs. the District and Market Segment. If the Blue line (current property) is consistently above the Red (District) or Green (Market Segment), this means it is priced above the overall market. If there is an intersection with any of the District or Market lines (and up-trending), it could mean that it is better performing over time. The reverse can also happen where it under-performs the District or Market Segment.
C. Period Selector
- Description: The period selector changes the time period of the chart and KPIs. Tap on each selection to choose between a 3 year or 5 year time horizon.
- Tip: If you do not see any Blue (current property) points, changing the period may show more data. In this case, the property may not have had any transactions within the 3 year period.
D. Rent PSF Performance KPIs
- Description: Push up the panel to show the Rent PSF Performance KPIs, which shows the beginning Rent PSF and the ending Rent PSF of the period, for the current property, the District and the Market Segment of a similar property type compared to the current property. For example, if the current property is a Condominium, the Rent PSF KPIs for District and Market Segment will be of the Condominiums in the District and Market Segment.
- Tip: Push Up to see more.
E. AI Overview
- Description: Ai analyses the property’s underlying rent PSF data and compares it with the district and market segment’s rent PSF to provide deeper insights and if it is out-performing or under-performing the market.
- Tip: Changes in the data will have a different outcome of the analysis.
F. Property Rentals
- Description: Current property’s Rent PSF over the period and over the last 1 year (12 months).
- Tip: Pay attention to the Change number. Positive growth is shown in Blue and negative growth is shown in Red.
G. District Rentals
- Description: District’s Rent PSF over the period and over the last 1 year (12 months).
- Tip: Pay attention to the Change number. Positive growth is shown in Blue and negative growth is shown in Red.
H. Region or Market Segment Rentals
- Description: Region or Market Segment’s Rent PSF over the period and over the last 1 year (12 months).
- Tip: Pay attention to the Change number. Positive growth is shown in Blue and negative growth is shown in Red.
Exceptions and Error Handling
No transactions found.
Description: If you don’t see any current property Rent PSF, it could mean that this property has no transactions within the period.
Solution: Change the period by selecting a different period.
Contact and Support
Need further assistance? Contact our support team via the About section on our website or email support@cribs.com.sg
