Recent Sales page shows all the sales transactions of the property.
Intended Users
About
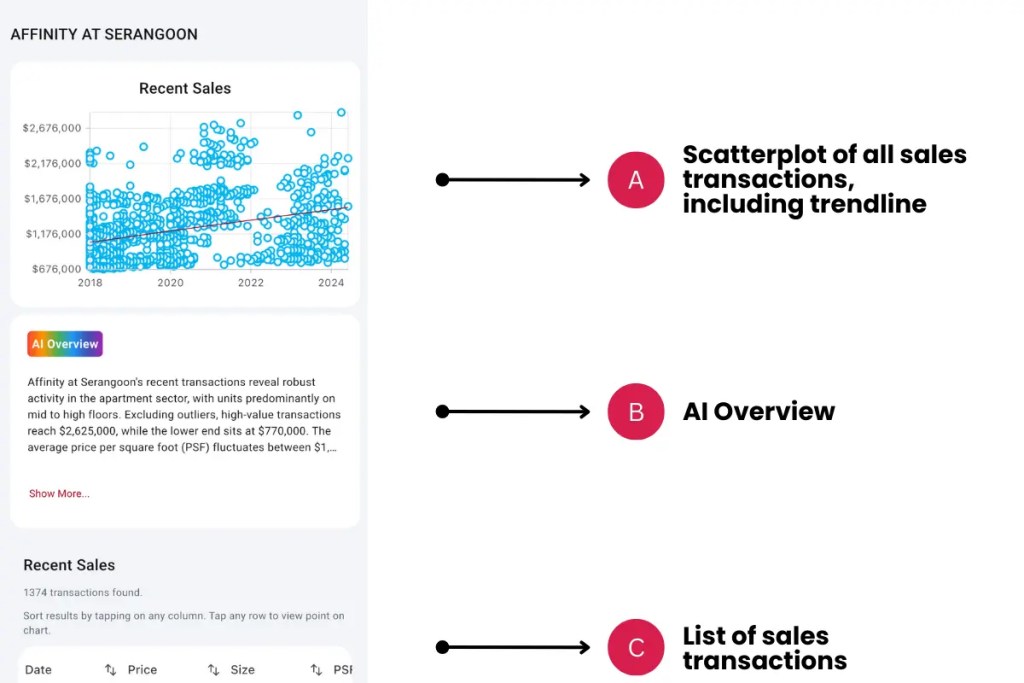
The Recent Sales page shows all the sales transactions of the property, including a scatterplot graph with a trendline. This page is launched from the Property Details page, under Learn More options. Scatterplots are preferred over Line Charts as they provide a more accurate depiction of when the transaction occurs. This is an important aspect of AI/Machine Learning – the data is not averaged or aggregated before analysis.
Elements
A. Scatterplot of all sales transactions, including a trendline
- Description: All sales transactions are plotted on a scatterplot graph with a trendline. This shows the past relationship between prices and if there is a cluster of prices that the property is trending towards.
- Tip: The trendline shows the linear regression of the sales transactions and usually suggests a gradual increase or decrease in prices, depending on the slope of the line.
B. AI Overview
- Description: AI analyses the recent sales transactions and provides a deeper analysis of the transactions. It will identify trends and remove outliers in its consideration.
- Tip: Transactions are updated daily and the AI analysis changes over time.
C. List of sales transactions
- Description: The list of sales transactions of the property – contract date, property type, size (in sqft), PSF and price.
- Tip: Filter any column by tapping to filter ascending or descending. By default, the list is sorted by the latest transactions first.
Exceptions and Error Handling
No transactions found
Description: If you don’t see any transactions, there are no Sales of the property yet.
Solution: None.
Contact and Support
Need further assistance? Contact our support team via the About section on our website or email support@cribs.com.sg
