Private Properties page provides users with summary of the latest private property activities in Singapore such as latest sales, rentals, best sellers, sales and rent listings, average prices and volumes and average rentals and rent volumes.
Intended Users
About
Private Properties page provides users with summary of the latest private property activities in Singapore such as latest sales, rentals, best sellers, sales and rent listings, average prices and volumes and average rentals and rent volumes. It provides a quick glance on the high level KPIs and is useful for users who are interested in sales or marketing and finding new opportunities or upcoming trends. This page can be launched from the Home page under Private Properties, or by tapping on any of the Home page private properties KPIs.
Elements
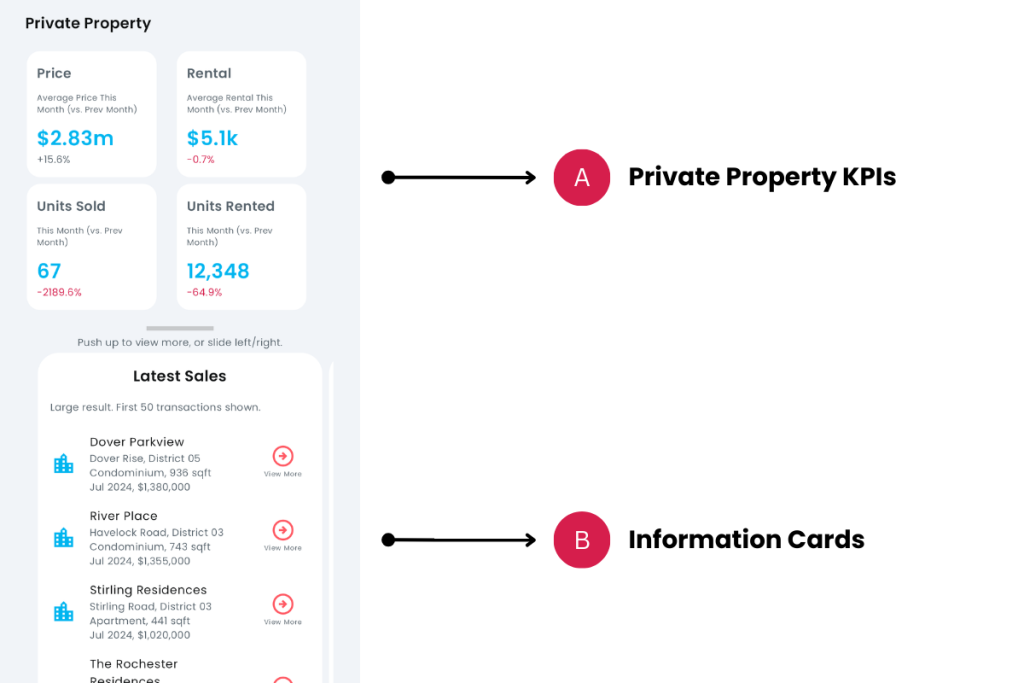
A. Private Property KPIs
- Description: A summary of KPIs – average prices sold in Singapore, number of units sold, average rental in the district and number of units rented.
- Tip: The percentage comparison is current month vs. previous month of data. Rental data might be delayed, due to the availability of URA data.
B. Information Cards
- Description: The information cards provide more information on the various property activities – latest sales, rentals, best sellers, sales and rent listings, average prices and volumes and average rentals and rent volumes.
- Tip: Push up the information panel and slide left or right to access the various cards.
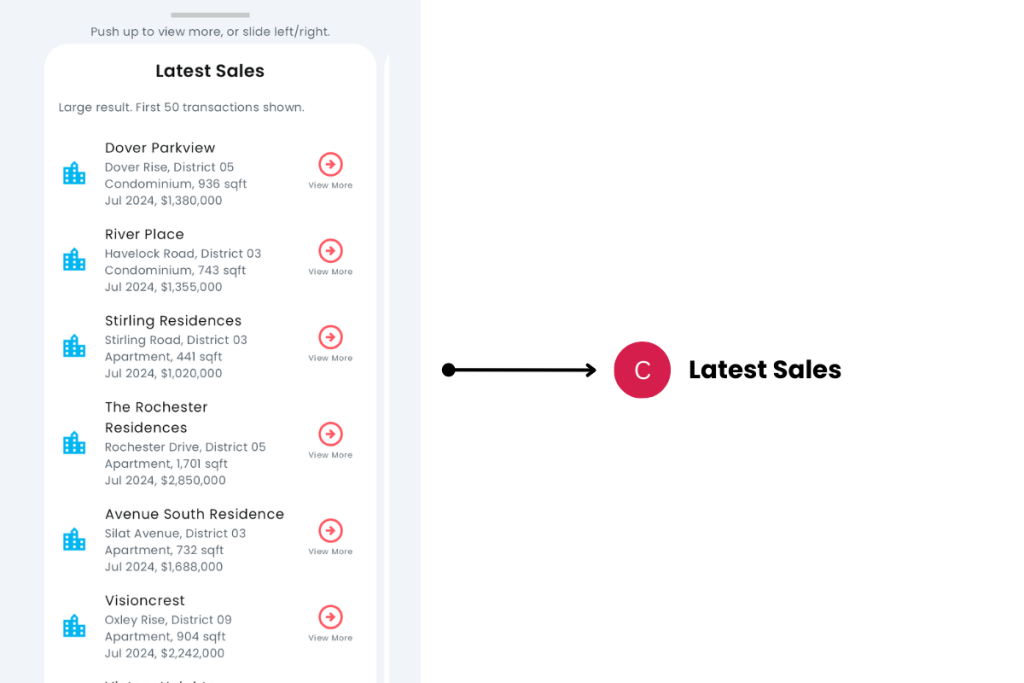
C. Latest Sales
- Description: List of sales transactions in Singapore. Only the first 50 transactions are shown.
- Tip: The list is sorted by latest transactions first. Tap on any row to go to the Property Details page.
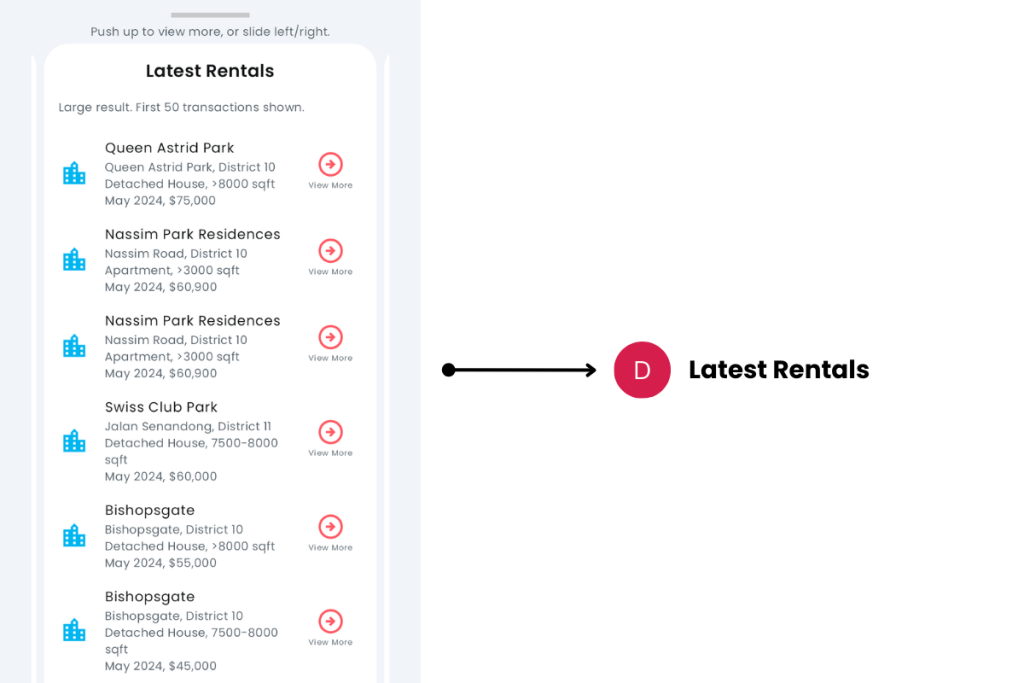
D. Latest Rentals
- Description: List of rental transactions in Singapore. Only the first 50 transactions are shown.
- Tip: The list is sorted by latest rentals first. Tap on any row to go to the Property Details page.
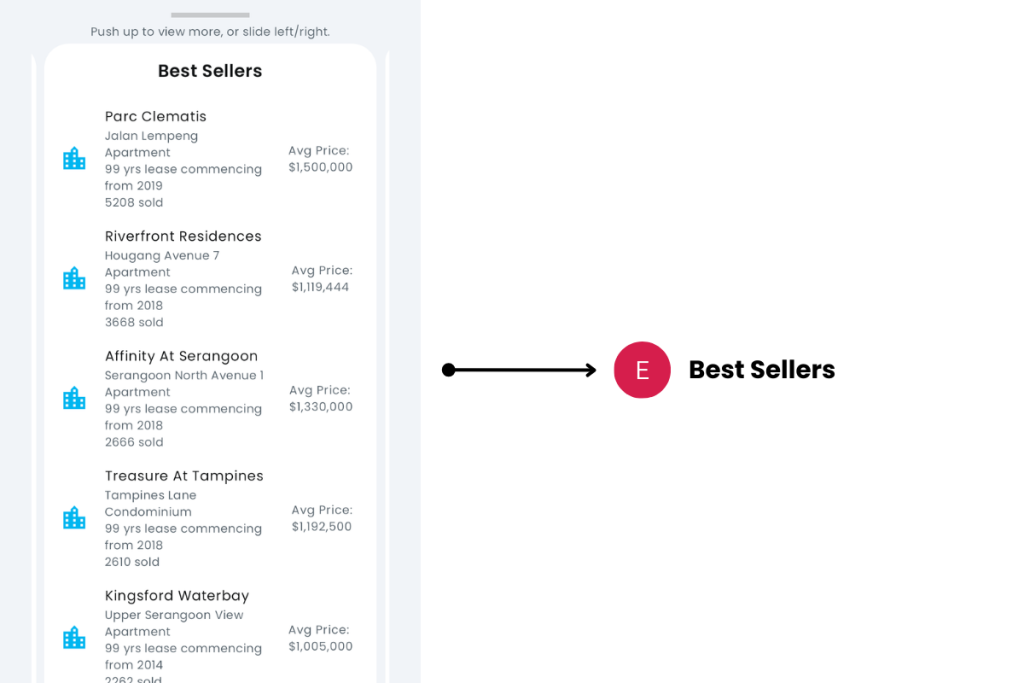
E. Best Sellers
- Description: List of Best Sellers in Singapore.
- Tip: The list is sorted by the highest number of sales. Tap on any row to go to the Property Details page of the property.
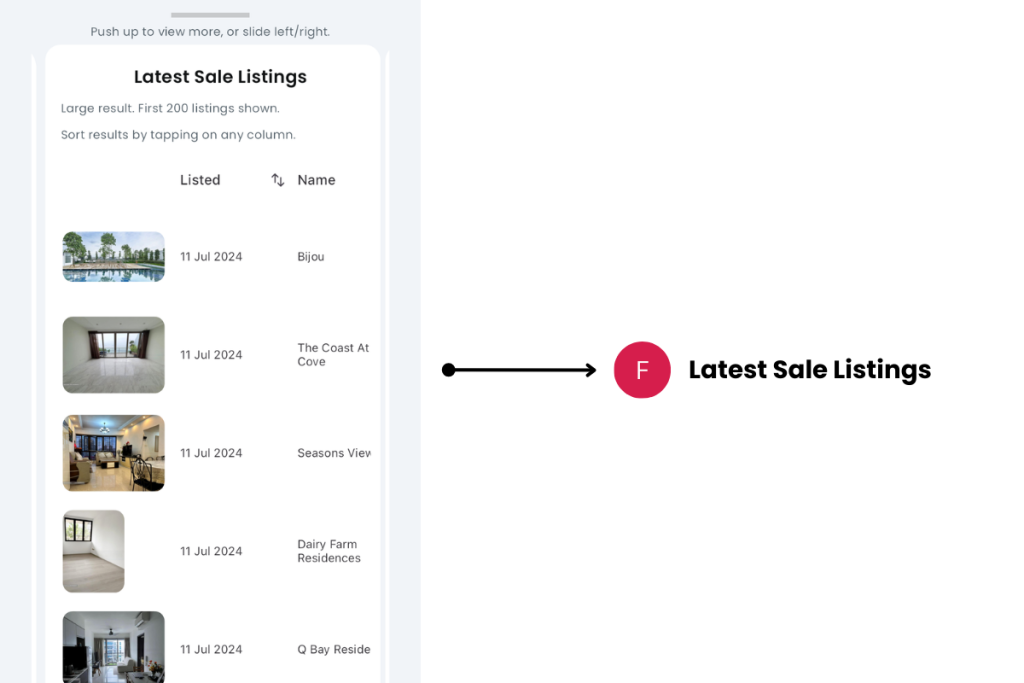
F. Latest Sale Listings
- Description: Latest sale listings in Singapore across major property platforms.
- Tip: Tap on any row to go to the platform’s listing of the property.
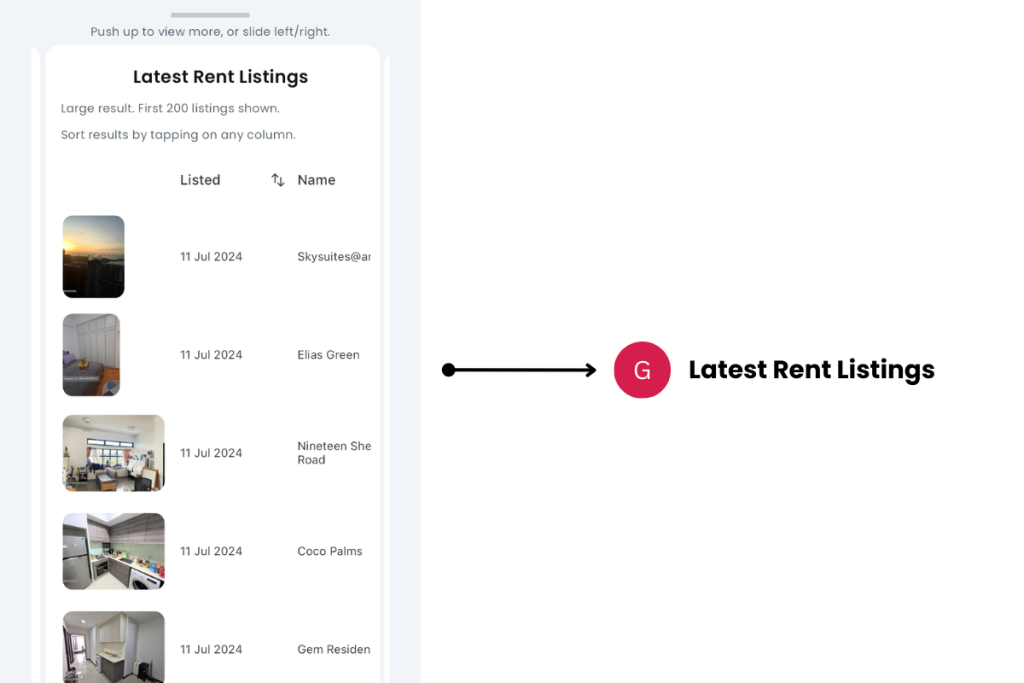
H. Latest Rental Listings
- Description: Latest rent listings in Singapore across major property platforms.
- Tip: Tap on any row to go to the platform’s listing of the property.
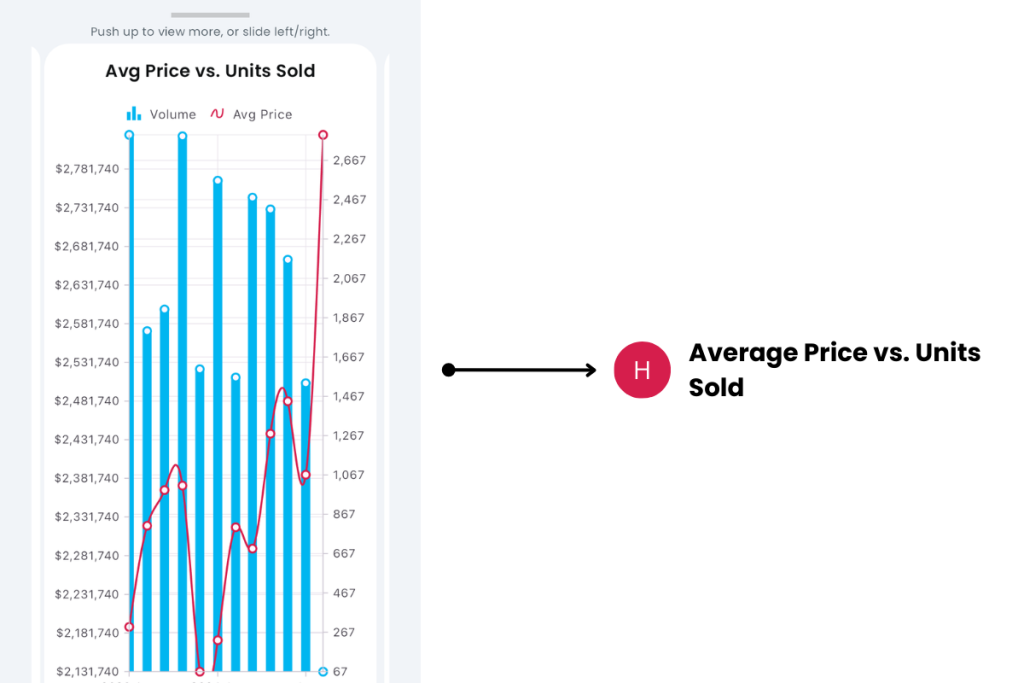
I. Average Prices vs. Units Sold
- Description: Combined chart of average property prices in Singapore and units sold. The left axis is the property price, while the right axis is the number of units sold. Only the past 12 months is shown.
- Tip: Tap on any point on the chart to view the date and average price or units sold.
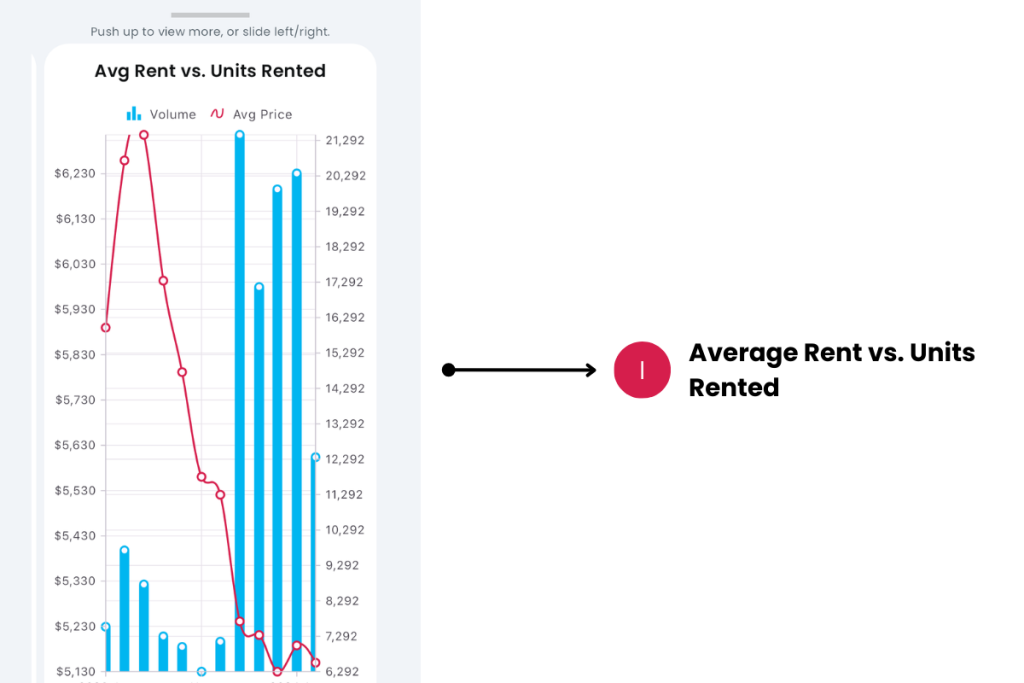
J. Average Rent vs. Units Rented
- Description: Combined chart of average rental prices in Singapore and units rented. The left axis is the rental price, while the right axis is the number of units rented. Only the past 12 months is shown.
- Tip: Tap on any point on the chart to view the date and average rent or units rented.
Exceptions and Error Handling
Latest month of rental dates are not reflected.
Description: URA is usually a month behind rental data.
Solution: None.
Contact and Support
Need further assistance? Contact our support team via the About section on our website or email support@cribs.com.sg.
FAQs
Who is the intended audience for the Private Properties page?
The Private Properties page is designed for Ultra and Pro users, particularly those interested in sales, marketing, discovering new opportunities, or identifying upcoming trends.
How can I access the Private Properties page?
You can launch the Private Properties page from the Home page under Private Properties or by tapping on any of the Home page private properties KPIs.
What are the Private Property KPIs?
The Private Property KPIs include average prices sold, number of units sold, average rental in the district, and number of units rented. The data is compared month-over-month.
What do the Information Cards provide?
The Information Cards offer details on various property activities such as latest sales, rentals, best sellers, listings, average prices, volumes, and average rentals and rent volumes. Users can slide the information panel left or right to access different cards.
How are the Latest Sales transactions listed?
The Latest Sales transactions list shows the first 50 sales transactions in Singapore, sorted by the latest transactions first. Users can tap on any row to view the Property Details page.
What information is available in the Latest Rentals section?
The Latest Rentals section lists the first 50 rental transactions in Singapore, sorted by the latest rentals first. Tapping on a row will navigate to the Property Details page.
What are Best Sellers and how are they listed?
The Best Sellers section lists properties with the highest number of sales in Singapore. Users can tap on any row to go to the Property Details page of the property.
How can I view the details of latest sale and rental listings?
The Latest Sale Listings and Latest Rental Listings sections display listings from major property platforms in Singapore. Tapping on any row will redirect you to the platform’s listing of the property.
What charts are available for average prices and rentals?
There are combined charts for Average Prices vs. Units Sold and Average Rent vs. Units Rented. These charts show data for the past 12 months, with the left axis representing prices and the right axis representing the number of units sold or rented. Tapping on any point on the chart will display the date and corresponding data.
